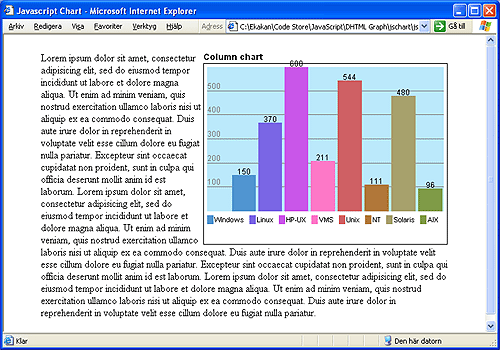
Wouldn't it be nice to be able to add a stylish and colorful chart to your Web page with minimal effort and still avoid slow-loading Java applets or server side generated images? Then the JavaScript Chart is just what you need! The JavaScript Chart supports: Several charts on the same page No limit on the number of data items in one chart (as long as you have enough space) Pass the chart data as a string in the following format: Item A;1;Item B;2;Item C;3. Gridlines are automatically created and spaced with appropriate increments depending on the highest value in the data range Choose if item values should be displayed or not on each individual chart Choose if the chart legend should be displayed or not Each data item will automatically get a different matching color Each chart can be rendered in debug mode, showing some useful information if the chart is not displayed as expected Modification of some of the layout parameters with CSS
Download demo - 5.66 KB
No comments:
Post a Comment