Showing posts with label Charts. Show all posts
Showing posts with label Charts. Show all posts
Sunday, July 27, 2008
Saturday, May 17, 2008
Eastwood Chart Servlet
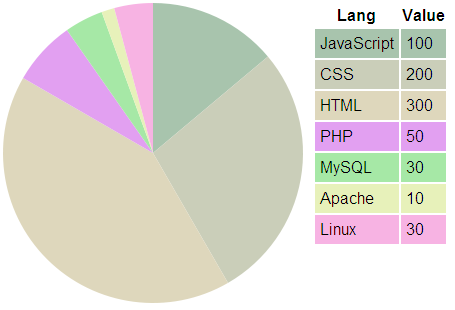
Eastwood is a free servlet that emulates the function of the Google Chart API, using JFreeChart to render the charts. Eastwood is aimed at web developers that want to incorporate charts into their web pages, and features:
support for generating pie charts, bar charts, line charts and scatter plots, using encodings that match the Google Chart API;
JFreeChart
JFreeChart supports pie charts (2D and 3D), bar charts (horizontal and vertical, regular and stacked), line charts, scatter plots, time series charts, high-low-open-close charts, candlestick plots, Gantt charts, combined plots, thermometers, dials and more. JFreeChart can be used in applications, applets, servlets and JSP. This project is maintained by David Gilbert.
FusionCharts Free
FusionCharts Free is a flash charting component that can be used to render data-driven & animated charts for your web applications and presentations.
It is a cross-browser and cross-platform solution that can be used with PHP, Python, Ruby on Rails, ASP, ASP.NET, JSP, ColdFusion, simple HTML pages or even PowerPoint Presentations to deliver interactive and powerful flash charts. You do NOT need to know anything about Flash to use FusionCharts. All you need to know is the language you're programming in.
Open Flash Chart .NET
Open Flash Chart .NET (OFC.NET) is based on the Open Flash Chart project located at http://teethgrinder.co.uk/open-flash-chart/ (or SourceForge). Source code for OFC.NET is located on a Subversion server provided by K2 Colocation at http://svn.k2colocation.com/svn/OpenFlashChart.
Open Flash Chart
Open Flash Chart
 Open Flash Chart, is open source. It is free to use and you get the source code to fiddle with!
Monday, April 28, 2008
amCharts - Flash Charts and Charting Software
Line & Area chart sets a new standard of usability for line & area charts. A visitor to your website will be able to zoom in on a particular period, turn values on and off, and show or hide graphs. With this tool, you can make:
- A simple line & area chart
- A stacked line & area chart
- A 100% stacked line & area chart
Pie & Donut chart
You can use it to create:
- 2D or 3D pie charts
- 2D or 3D donut charts
- Beautiful navigation clusters
Column & Bar chart
lets you build:
- 2D or 3D column charts
- 2D or 3D bar charts
- Stacked bar or column charts
-100% stacked bar or column charts
- Floating bar or column charts
- Bar or column and line chart mix
Scatter (XY) & Bubble chart can be used to display various scientific data, as well as presenting three-dimensional data in a 2D format.
With this chart, you can make:
- Scatter charts
- Bubble charts
- Time plots
WebFX Chart Demo
Chart Types
A few different chart types are supported and they can be combined in a variety of configurations even in the same chart. The following types are supported:
Area
Line
Stacked Area
Stacked Line
Vertical Bars
Demo
Download
Plotr - a javascript framework which enables you to render charts (Solutoire.com)
Plotr is a javascript framework which enables you to render charts in most modern browsers. It's based on the PlotKit Framework (renderer for Mochikit) and it depends on the Prototype Javascript Framework.
Plotr Project site
Downloads:
Latest version: 0.3.0
plotr-0.2.0.zip
plotr-0.3.0.zip
Examples:
Horizontal/vertical BarChart example
LineChart example
PieChart example
Legend example
PlotKit - Javascript Chart Plotting
PlotKit is a Chart and Graph Plotting Library for Javascript. It has support for HTML Canvas and also SVG via Adobe SVG Viewer and native browser support.
PlotKit is fully documented and there is a quick tutorial to get you started.
PlotKit is a complete rewrite of CanvasGraph. It is better structured and supported.
Requirements:
MochiKit 1.3 or higher
HTML Canvas: Safari 2+, Opera 9+, Firefox 1.5+, IE 6 (in emulated mode)
SVG: Opera 9+, Firefox 1.5+ (see note), IE6 with Adobe SVG.
Download:
Latest Version is : 0.9.1 - plotkit-0.9.1.zip
Last Updated: 29 August 2006
Documentation:
PlotKit Documentation - Complete documentation
PlotKit Quick Start
Examples:
PlotKit Dynamic Charting Test - Redrawing values from a dynamic table.
PlotKit Simple Canvas Demo - A self contained demo in a single file. Use this to get started!
PlotKit Simple SVG Demo - A self contained demo in a single file. Use this to get started!
Sweet Canvas Test
Sweet SVG Test
Simple Canvas Test
Simple SVG Test
liquidx.net Stats Page
Emprise JavaScript Charts - 100% Pure JavaScript Charts
Features:
- Interactive: Features such as Hints, Mouse Tracking, Mouse Events, Key Tracking and Events, Zooming, Scrolling, and Crosshairs raise interactivity and user experience in web charting to a new level.
- Axis Scaling: There's no need to determine your data range before hand. EJSChart will calculate and scale automatically to fit whatever data it is presented with.
- Auto Zooming, Scrolling: Too much data and not enough screen real estate? Show it all. Let your end users zoom in on the pieces they're most interested in. Axis locking for single axis zoom, scrolling and automatic axis scaling are all included.
http://www.ejschart.com/examples/index.php
Open Flash Chart
Download Open Flash Chart, this includes the PHP class.
Read the tutorial.
Check out the gallery.
Helper classes:
Java
Perl
Python
Ruby and Rails
PHP
.NET
AnyChart - Flash Charting
AnyChart is a flexible Adobe Flash based solution that allows you to create interactive and great looking flash charts and dashboards. It is a cross-browser and cross-platform charting solution intended for everybody who deals with creation of dashboard, reporting, analytics, statistical, financial or any other data visualization solutions.
Attractive data visualization is an essential part of any service or application. Ubiquity and performance of Flash technology makes it, probably, the best solution for charting needs.
FusionCharts Free - Flash Charts and Graphs
FusionCharts Free is a flash charting component that can be used to render data-driven & animated charts for your web applications and presentations.
It is a cross-browser and cross-platform solution that can be used with PHP, Python, Ruby on Rails, ASP, ASP.NET, JSP, ColdFusion, simple HTML pages or even PowerPoint Presentations to deliver interactive and powerful flash charts. You do NOT need to know anything about Flash to use FusionCharts. All you need to know is the language you're programming in.
Chart Gallery
Online Demos
Download
Charts And Graphs: Modern Solutions - Smashing Magazine
Ajax- or JavaScript-frameworks:
The Dojo Charting Engine can generate graphs and charts with few JavaScript snippets.
Charts and Graphs: Flash-based Solutions
- FusionCharts Free
- amCharts
- AnyChart Flash Chart Component
- Rich Chart Server for .NET
- Flash Charts Pro
- Swiff Chart Generator
- XML/SWF Charts
- Open Flash Chart (OFC)
Charts and Graphs: JavaScript-based solutions
- Emprise JavaScript Charts
- PlotKit - Javascript Chart Plotting (the script requires MochiKit JavaScript library)
- Plotr
- Ajax MGraph
- CSS Vertical Bar Graphs
- CSS Diagrams
- CSS for Bar Graphs
- Dynamic Pie Chart with CSS
- Real World Bar Graphics with some CSS
- SAC Simple Accessible Charts
- CSS Line Graphs
- Vertical Bar Graphs with CSS and PHP
- An accessible bar chart
- Stu Nicholls definition list bar chart

- Chart Demo
Thursday, February 7, 2008
Tuesday, January 8, 2008
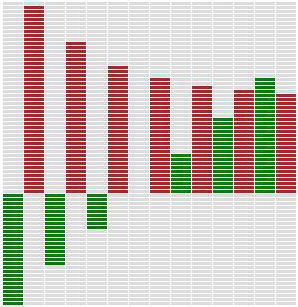
XSL stylesheets to convert XML into HTML bar charts
Digits to Charts (CodeProject)
This article presents several XSLT stylesheets for converting XML numerical data to eye-candy HTML bar charts.
Download stylesheets - 22.5 Kb
This article presents several XSLT stylesheets for converting XML numerical data to eye-candy HTML bar charts.
Download stylesheets - 22.5 Kb
Subscribe to:
Posts (Atom)